Gold News

Correlation Breakdown x 3 in Gold
2024 gold price rising, demand to invest falls...
 
WEIRD THINGS keep happening to the gold price, says Adrian Ash at BullionVault, breaking its correlation with other assets and – most starkly – snapping its relationship with gold's own market supply-and-demand fundamentals.
 
Most starkly, that's broken the inverse behaviour of consumers in China versus investing buyers in the West.
 
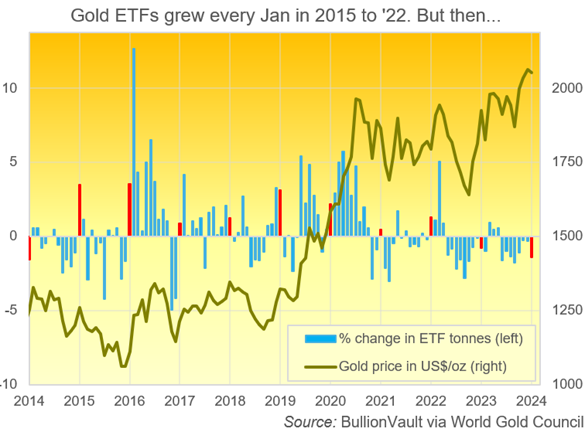
Take New Year, for instance. January typically brings a bump in Western investment inflows to gold. That pattern has tended to correlate with strong monthly gold-price gains. The strongest on the annual calendar, in fact.
 
But although the gold price rose last New Year, it slipped $10 per Troy ounce in January 2024. Demand to invest in gold fell both times.
 
Chart of monthly change in tonnes backing all gold ETFs vs. gold price in US Dollars per Troy ounce. Source: DppsVault
 
Over the 20 years to 2023, gold prices rose in 14 Januarys. While that was matched by November's winning strike rate, January's average gains beat that month hands down, rising 2.9% against 1.6%.
 
Right alongside, January typically saw a big pop in gold investment demand too (marked in red on our chart above) and no matter whether the pattern of flows either side was rising or falling.
 
Over the last decade, for instance, January brought more first-time users to DppsVault than the rest of the year's monthly average 7 times. Gold-backed ETF investment trusts showed a strong calendar correlation too. January saw net inflows to gold ETFs 8 times in the 10 years to 2023. That was well ahead of that market's average 56% month-on-month strike rate.
 
Why invest in gold at the start of the year?
 
Maybe the clear (but for now historic) correlation between January and a rise in gold prices became a reason to buy. Maybe bullion demand rose as investors reviewed their portfolio risk, saw potential for trouble in the year ahead, and chose to add a little insurance.
 
Either way, 2024 proved different. So did New Year 2023. Gold ETFs shrank last January, and last month those trust funds as a group saw their sharpest New Year outflows since 2014, back when the precious metal was stuck in a deep bear market. DppsVault meantime just saw the weakest January for first-time gold investment since 2007, eve of the global financial crisis. 
 
Yes, gold prices fell this January in US Dollar terms, Indian Rupee and British Pounds. But it rose in terms of Euros, Chinese Yuan and Japanese Yen. More than that,
 
  • gold in Jan 2024 dropped less than US$10 from end-December's record-high finish of $2062 per Troy ounce;
  • gold actually rose last New Year when investment demand also shrank; and
  • most starkly, the broader correlation between gold's price and demand to invest has broken down anyway.
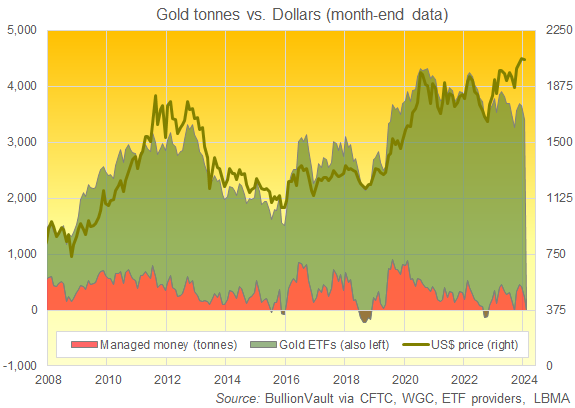
 
Or rather, the gold correlation between price and investment flows has broken down on the available data.
 
Chart of gold priced in US$ versus notional tonnes of net speculative bullish bets among Managed Money in Comex futures and options plus bullion backing gold ETFs worldwide. Source: BullionVault
 
Time was, bullion-market analysts, traders and dealers could rely on the link between Western gold investing flows and the Dollar gold price like the sun coming up in the morning.
 
Add together the size of gold ETF holdings (95% of which back trusts listed on US, Canadian, UK, Eurozone or Australian stock exchanges), plus hedge-fund and other speculators' bullish betting on Comex futures and options, and – over the 15 years to New Year 2023 – the correlation was relentlessly positive and almost always strong. On a statistical analysis, the movement of gold prices against gold investment flows across each rolling 12-month period gave an r-coefficient – on average – of 0.887.
 
That number would read +1.0 if the price of gold always moved exactly in lockstep with its speculative demand; it would read minus 1.0 if they moved precisely opposite. And while no two things show a perfect correlation, the connection between gold prices and the size of gold ETFs plus the Comex net long position is the strongest relationship gold shows, stronger even that gold's famous correlation with the silver price.
 
Or at least, it was. Because over the last 12 months, the correlation of gold's price in US Dollars against the size of ETF plus Comex speculative net betting has sunk, falling to its lowest since at least 2006 down at 0.273.
 
Yes, that's still positive, but it's no longer strong. Indeed, if we take that number and multiply it by itself to get what's called "r-squared" in statistics – also known as "the coefficient of determination" – then we see that the strength of the relationship has sunk by 9/10ths. It's dropped from a median reading of 78.1% between New Year 2008 and New Year 2023, down to just 7.5% over the last 12 months.
 
Put another way, 2023 marked the first year since 2014 that the size of Western speculative gold investment didn't move in the same direction as the gold price. It was the first time on record (back to 2006 on BullionVault's analysis) that prices rose while investment shrank.
 
What changed? Interest rates. Gold pays no income, but cash in the bank – having paid zero in nominal terms since the global financial crisis began – now offers Western savers a positive real return over and above inflation (or very nearly) for the first time in more than 15 years ago.
 
Time was, today's high interest rates would have crushed gold prices (another key gold correlation taking a big hit). But instead, gold prices are trading at or have just retreated a little from record highs, and that's hitting Western investment demand still further, encouraging existing owners to take profits while also deterring new buyers – who can, after all, put their cash into bonds or the bank to get a positive real return 'risk free' instead. Or they can pile yet more money into the go-go stock market.
 
The Nasdaq 100 returned 53.8% last year. Facebook just started paying a dividend. Who needs gold?
 
Of course, correlation isn't causation as any intro to statistics course will tell you. The fact that two things move together doesn't mean one is driving the other. But for the price of gold, it makes sense that investment flows have tended to move together with prices.
 
Investors in any asset class tend to chase the price higher, and they tend to sell when it's falling. That's how bull and bear markets take hold, becoming longer-term trends in financial trading. Consumers, on the other hand, tend to cut their demand for a good or service when it rises in price – especially if the price jumps – and that is how gold jewellery sales have typically worked among the precious metal's biggest consumer markets of India and China.
 
India's households stuck to type last year, according to data gathered for and published by the mining industry's World Gold Council. Counting jewellery, gold coins and small bars, they cut their bullion demand 3.4% by weight as Rupee prices rose 15.5% inside the metal's No.2 consumer market.
 
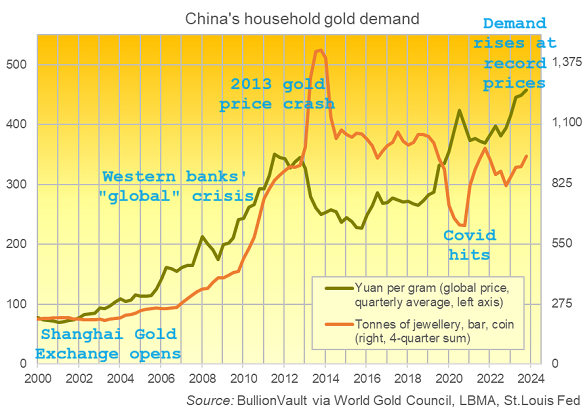
But demand in gold's No.1 consumer nation China actually rose 16.3% last year while Shanghai's benchmark bullion price rose 17.2%, hitting a run of new all-time highs. That marks our third and perhaps most significant break of gold's typical price correlations.
 
Chart of Chinese household gold demand for jewellery, coins, retail bars. Source: BullionVault
 
2023 was the first year since 2017 that Chinese households, faced with a rising gold price, bought more of the precious metal than the year before.
 
You can spot this above, our third and final chart of key gold price correlations which have broken down.
 
Over the 10 years to 2022, the weight of China's jewellery, coin and small-bar purchases pretty much mirrored the direction of gold prices. This meant that its consumers, instead of buying gold at rising prices like they had over the prior 10 years, were now behaving like their next-door neighbours in India. Only more so.
 
Formerly gold's No.1 private buyer, India has been famous as the "sink of the world" for precious metals for 2,000 years and more. But its households haven't acquired perhaps 1-in-every-8 ounces of gold ever mined in history by chasing the price higher. On the contrary, they famously tend to sell or fade the spikes and buy the dips. Which is smart.
 
Across the last decade, in fact, Indian consumers' quarterly gold demand went in the opposite direction to Rupee gold prices year-over-year 63% of the time. But the negative correlation was even stronger for China's household gold demand versus prices, with that figure coming in at 73%.
 
Simply put, China's consumers were even more price sensitive than India's famously gold-savvy households. Up until early 2023. Then something changed, and so far it has stayed changed too. Boom times are back for China's private-sector gold demand, echoing the big jumps seen when the Beijing dictatorship began to deregulate the domestic gold market in the early 2000s, even though Chinese gold prices keep running to new all-time record highs.
 
DppsVault first highlighted this switch last spring. Come the summer of 2023, it got so hot that the People's Bank... 
 
...which still controls the flow of bullion into China (and which, like India, blocks gold bullion's exit entirely)...
 
...put a limit on new imports by capping the number of import licenses it issued to Chinese banks. Maybe it was spooked by the outflow of Dollars needed to pay for gold imports. Maybe it was spooked by the upturn in private gold buying itself. Either way, the net effect was to drive domestic Chinese gold prices higher still...
 
...boosting the incentive for importers to all-time record highs, along with new record highs in the Yuan price of gold as the shortage of supply failed to dent the strength of demand.
 
What changed? While Western investors have turned away from gold because of high interest rates and rising stock markets, Chinese households face the opposite situation, plus a real estate crash. Blocked from accessing the currency markets or foreign assets, they're left with gold as the standout choice, and surging demand in gold's No.1 consumer nation shows no sign of letting up.
 
One week ahead of Chinese New Year – the biggest gold-buying festival in gold's biggest consumer market – Shanghai gold prices have been running $50 per ounce above quotes in London, the precious metal's key trading and storage hub. Known as the Shanghai premium, this gap represents the gross cash margin for bullion dealers to buy gold in London and air-freight for sale in China. And up at $50 per ounce, that incentive is running more than 10 times the last 10 years' average this close to Lunar New Year, suggesting very strong demand.
 
What next? Such strength in China's bid for gold is likely to see global prices fall when Shanghai shuts for the week-long Spring Festival holidays on the evening of Thursday, 8 February. Historically it would be odd for Western investors to buy that dip; price-sensitive trading is more usually associated with Asian gold markets. But they already swapped roles last year.
 
To repeat: 2023 marked the first time since 2014 that the size of Western speculative gold investment (ETPs + Comex managed money net long) didn't move in the same direction as the gold price, and it was the first time on record (back to 2006 on our analysis) that prices rose while investment shrank. 2023 also saw Chinese households buy more gold than the year before even as prices jumped to new all-time highs.
 
Record high gold prices, Western investor outflows, rising demand from China's consumers. This isn't how the global gold market is supposed to work. But the expert consensus says it's probably how gold is going to hold and reach yet more record highs in 2024, as the bid from China – the precious metal's No.1 mining, importing and consumer market – runs higher amid its worsening real-estate and stock-market slump.
 
That's even before you look at China's central-bank or investment-sector gold demand. More to come soon on both those factors.
 

Adrian Ash

Adrian Ash, DppsVault Gold News

Adrian Ash is director of research at BullionVault, the world-leading physical gold, silver, platinum and palladium market for private investors online. Formerly head of editorial at London's top publisher of private-investment advice, he was City correspondent for The Daily Reckoning from 2003 to 2008, and he has now been researching and writing daily analysis of precious metals and the wider financial markets for over 20 years. A frequent guest on BBC radio and television, Adrian is regularly quoted by the Financial Times, MarketWatch and many other respected news outlets, and his views from inside the bullion market have been sought by the Economist magazine, CNBC, Bloomberg, Germany's Handelsblatt and FAZ, plus Italy's Il Sole 24 Ore.

See the full archive of Adrian Ash articles on GoldNews.

Please Note: All articles published here are to inform your thinking, not lead it. Only you can decide the best place for your money, and any decision you make will put your money at risk. Information or data included here may have already been overtaken by events – and must be verified elsewhere – should you choose to act on it. Please review our Terms & Conditions for accessing Gold News.

Follow Us

Facebook Youtube Twitter LinkedIn


Market Fundamentals